Dashboard
Dashboard Overview
The Dashboard is the central hub reporting, providing visibility into financial, operational, and system-wide metrics. For administrators, the dashboard is a powerful tool to monitor various metrics affecting administration operations and customer service.
Accessing the Dashboard
Upon logging into the system, users are directed by default to the Dashboard. You can also return to the Dashboard at any time by clicking the Current Software name or C icon in the navigation bar.
Dashboard Types
In the top-right corner, a dropdown menu allows administrators to switch between different dashboard types based on the type of insights needed, some examples include:
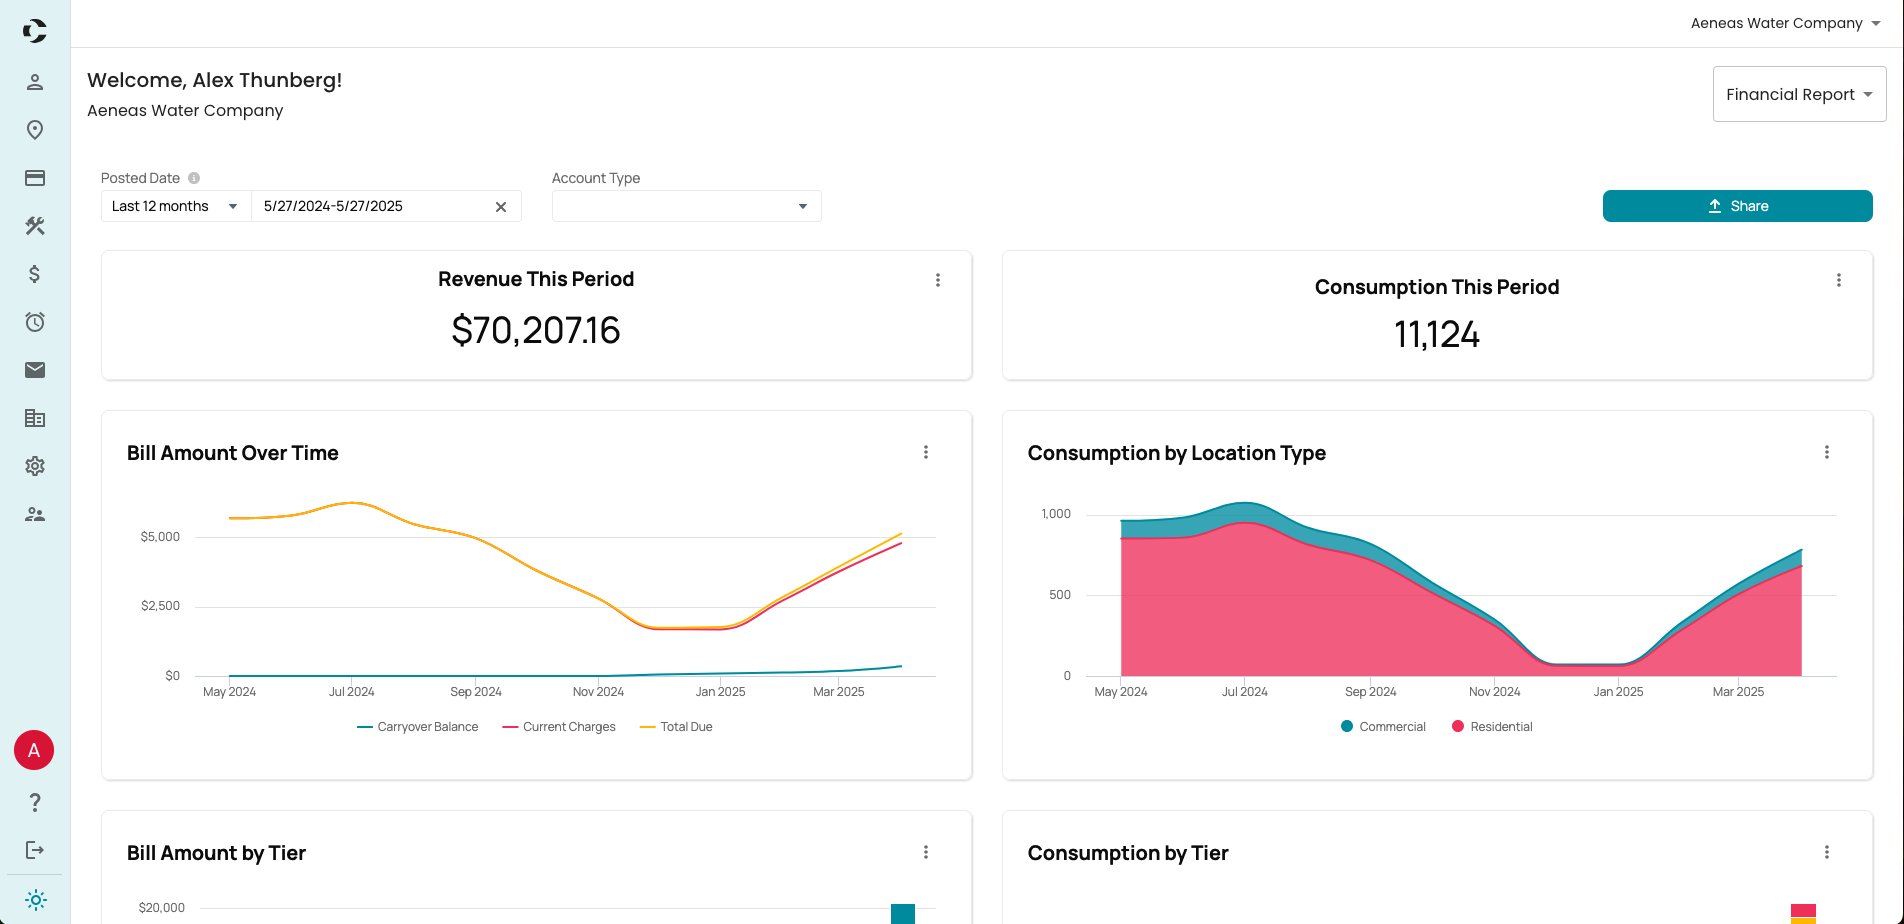
- Financial Report
- Provides a high-level overview of revenue, billing, collections, and usage metrics across the entire system. Ideal for tracking income and identifying anomalies in billing patterns.
- Operations Report
- Displays operational data that supports daily utility management, including meter statuses, failed email deliveries, and various others.
- Report Builder
- A flexible, self-service interface that allows administrators to design and generate custom reports. Reports can be tailored to internal policies, regulatory requirements, or ad hoc needs.
Filtering Data

Each dashboard includes filters that allow administrators to refine the displayed data for more accurate analysis. These filters appear along the top section of the dashboard and may include:
- Date Range: Most dashboards include a date selector to narrow the time frame of reported data.
- Context Filters: Some dashboards have context-specific filters. For example:
- The Billing Summary dashboard allows filtering by Billing Cycle to isolate and review cycle-specific results.
Filters update the dashboards in real time and are useful for comparing periods, limiting scope, and troubleshooting anomalies.
Working with Dashboard Widgets
Each dashboard consists of individual widgets - visual components such as charts, tables, and summary blocks. These widgets offer:
- Data Drill-Down: Click or hover into widgets to view the underlying dataset, allowing for deeper analysis and verification.
- Export Options: Most widgets support exporting data into formats such as Excel or PDF, enabling offline analysis, audit support, or integration with external tools.