Dashboard Basics - Navigating Filtering and Sharing
Dashboard basics - navigating, filtering, and sharing
1. Our reporting homepage is the Financial Report, which defaults to the last 12 months of history. You can see many interesting data points, such as total revenue and bills over time.
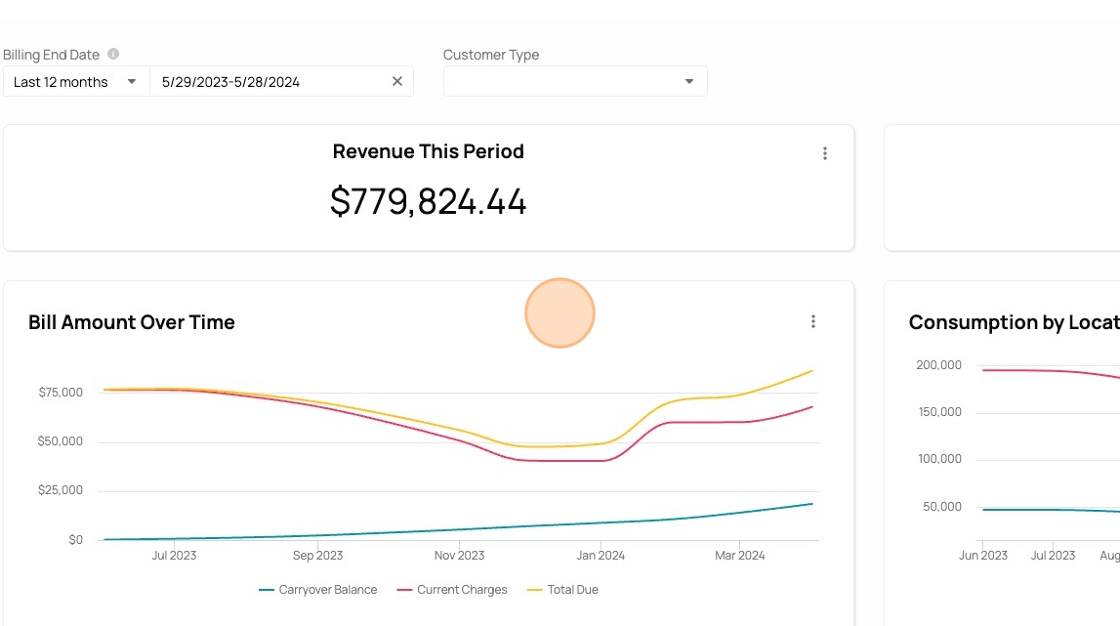
2. The top filters apply to the entire dashboard. Click here to change the filter period.

3. Click a new option, like "Last 6 complete months"

4. The dashboard charts will update in real time!

5. Hovering over charts gives you more information about each data point.

6. These are also clickable. When you select a data point, you get a couple of options, including "View Underlying Data"
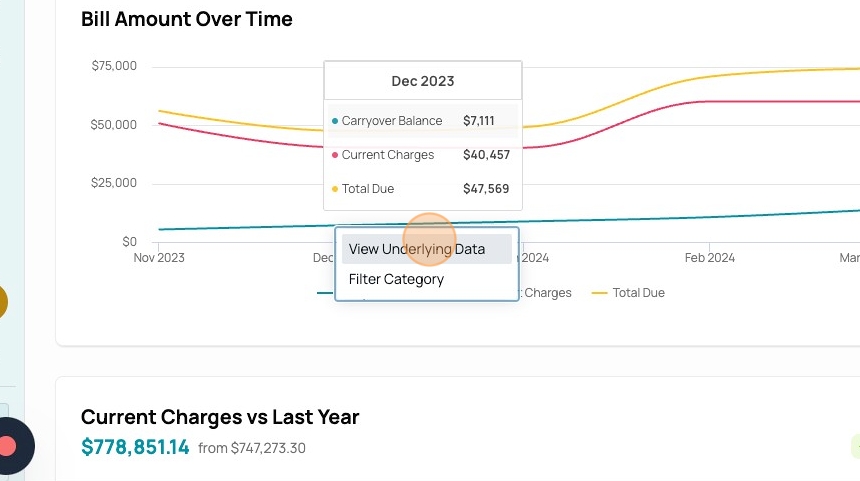
7. This pulls up a new table showing the individual records in that data point. You can continue interacting with this table, such as by clicking on a column to sort by that value.

8. You can also download or share this table from this icon.

9. Click "Download"
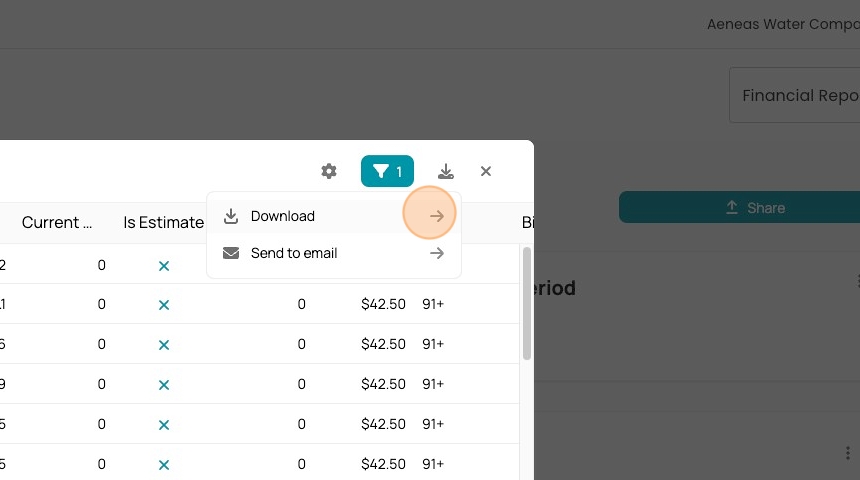
10. Your options are CSV or XLSX.

11. To close, click here.

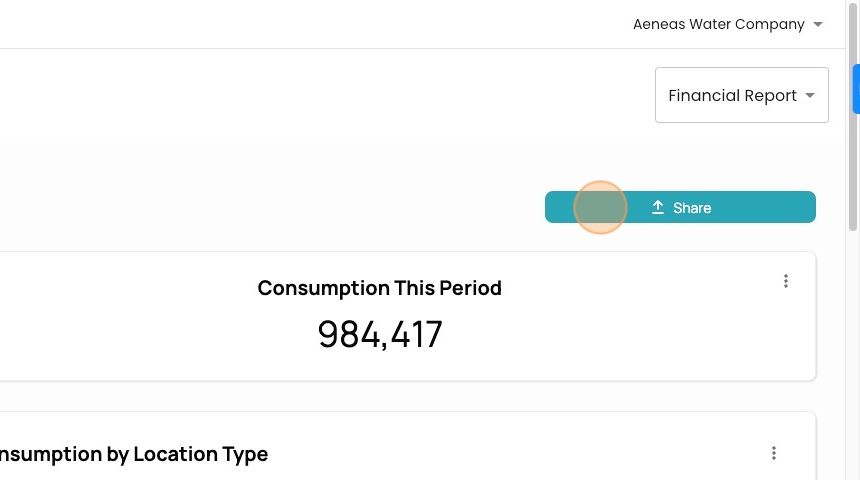
12. You can see other charts if you scroll down. These are all built in.

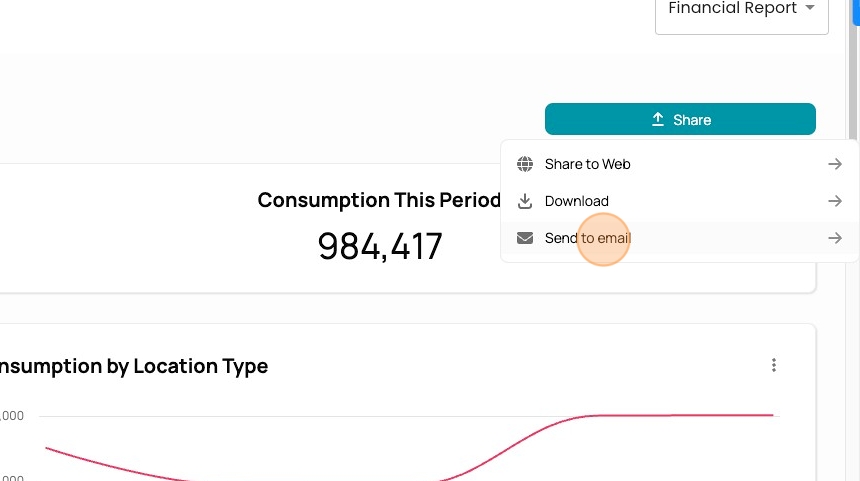
13. You can also share the entire dashboard from clocking this button.
14. You can publish the website, download it, or even email it.
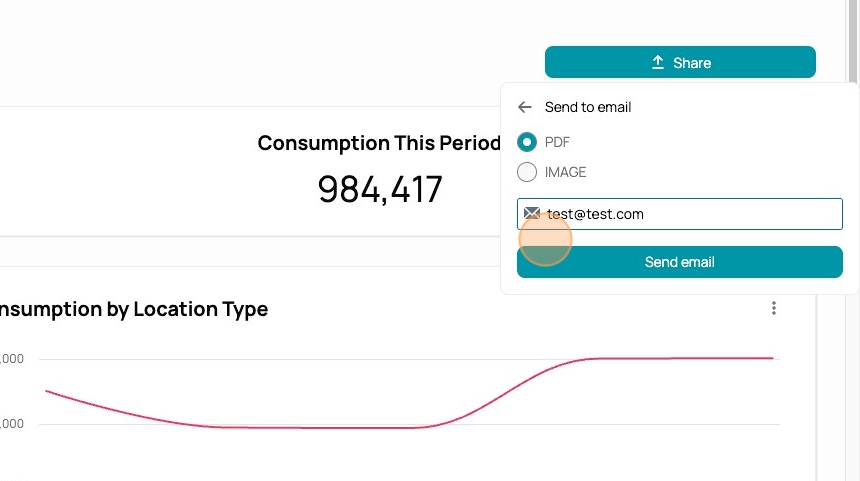
15. Here you can pick the form of emailing it and who to send it to.

16. Press send to share!
17. Finally, there are plenty of other reports that you can access from this top right dropdown. Explore for more reports!
