Interact with the Consumption and Charges Chart
Interact with the Consumption & Charges Chart
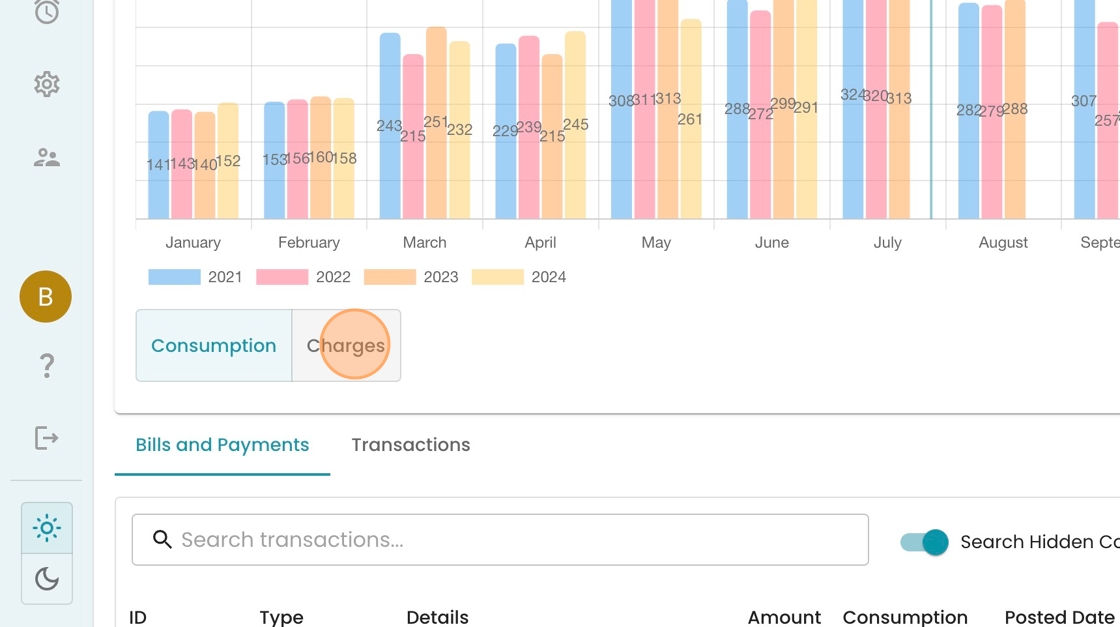
1. On an Accounts page, look for the Consumption Comparison chart, which shows you the customer's usage by month, compared to last year. Data labels are provided for easy interpretation.

2. To get a longer history, click the dropdown in the bottom right and select a different time range.

3. See how more years are now provided for context

4. To toggle to the dollars owed, click "Charges"
5. See now how the chart shows the dollar values in the bill, split by tier. If you hover over a section, you can get more detail.
